Livepeer Agent · Fal Expansion · image · typography
Typographic Poster Set · Grok Image 2.0
For months this project told agents one thing about text in generated images: never trust it. We tested whether Grok Imagine Image 2.0 changes that — at three difficulty levels, comparing every rendered string character by character against the brief.
Easy case — flat poster, 3/3 exact
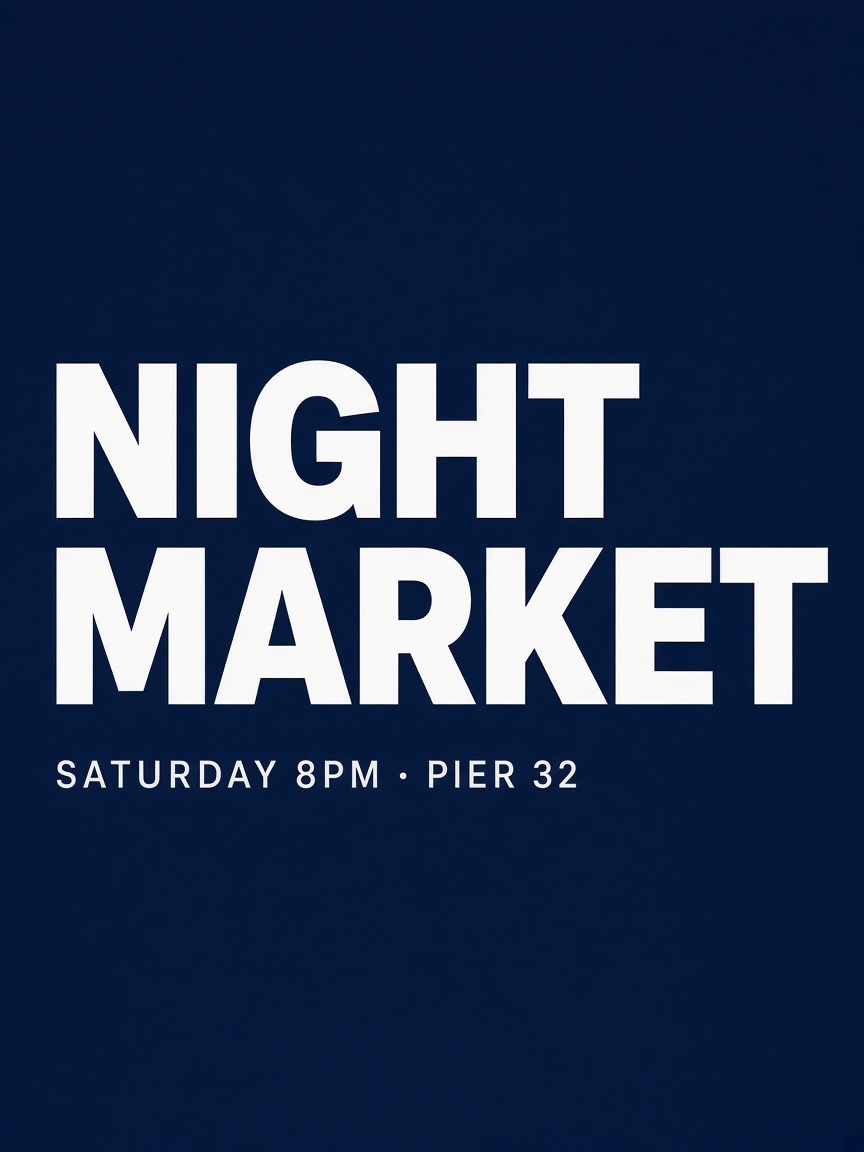
Required: NIGHT MARKET · SATURDAY 8PM · PIER 32 — exact, middot included
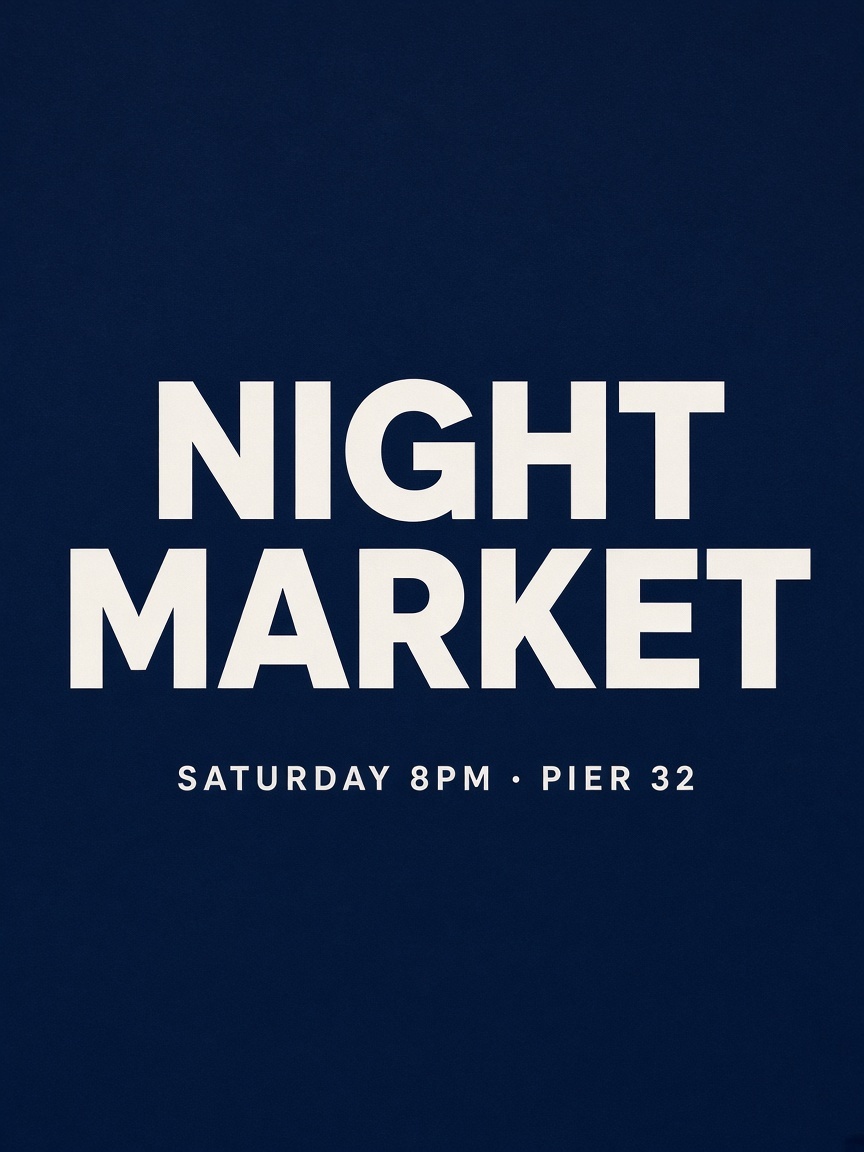
Same brief, different render — exact again. All three variants were correct.
Hard case — photoreal packaging with small print
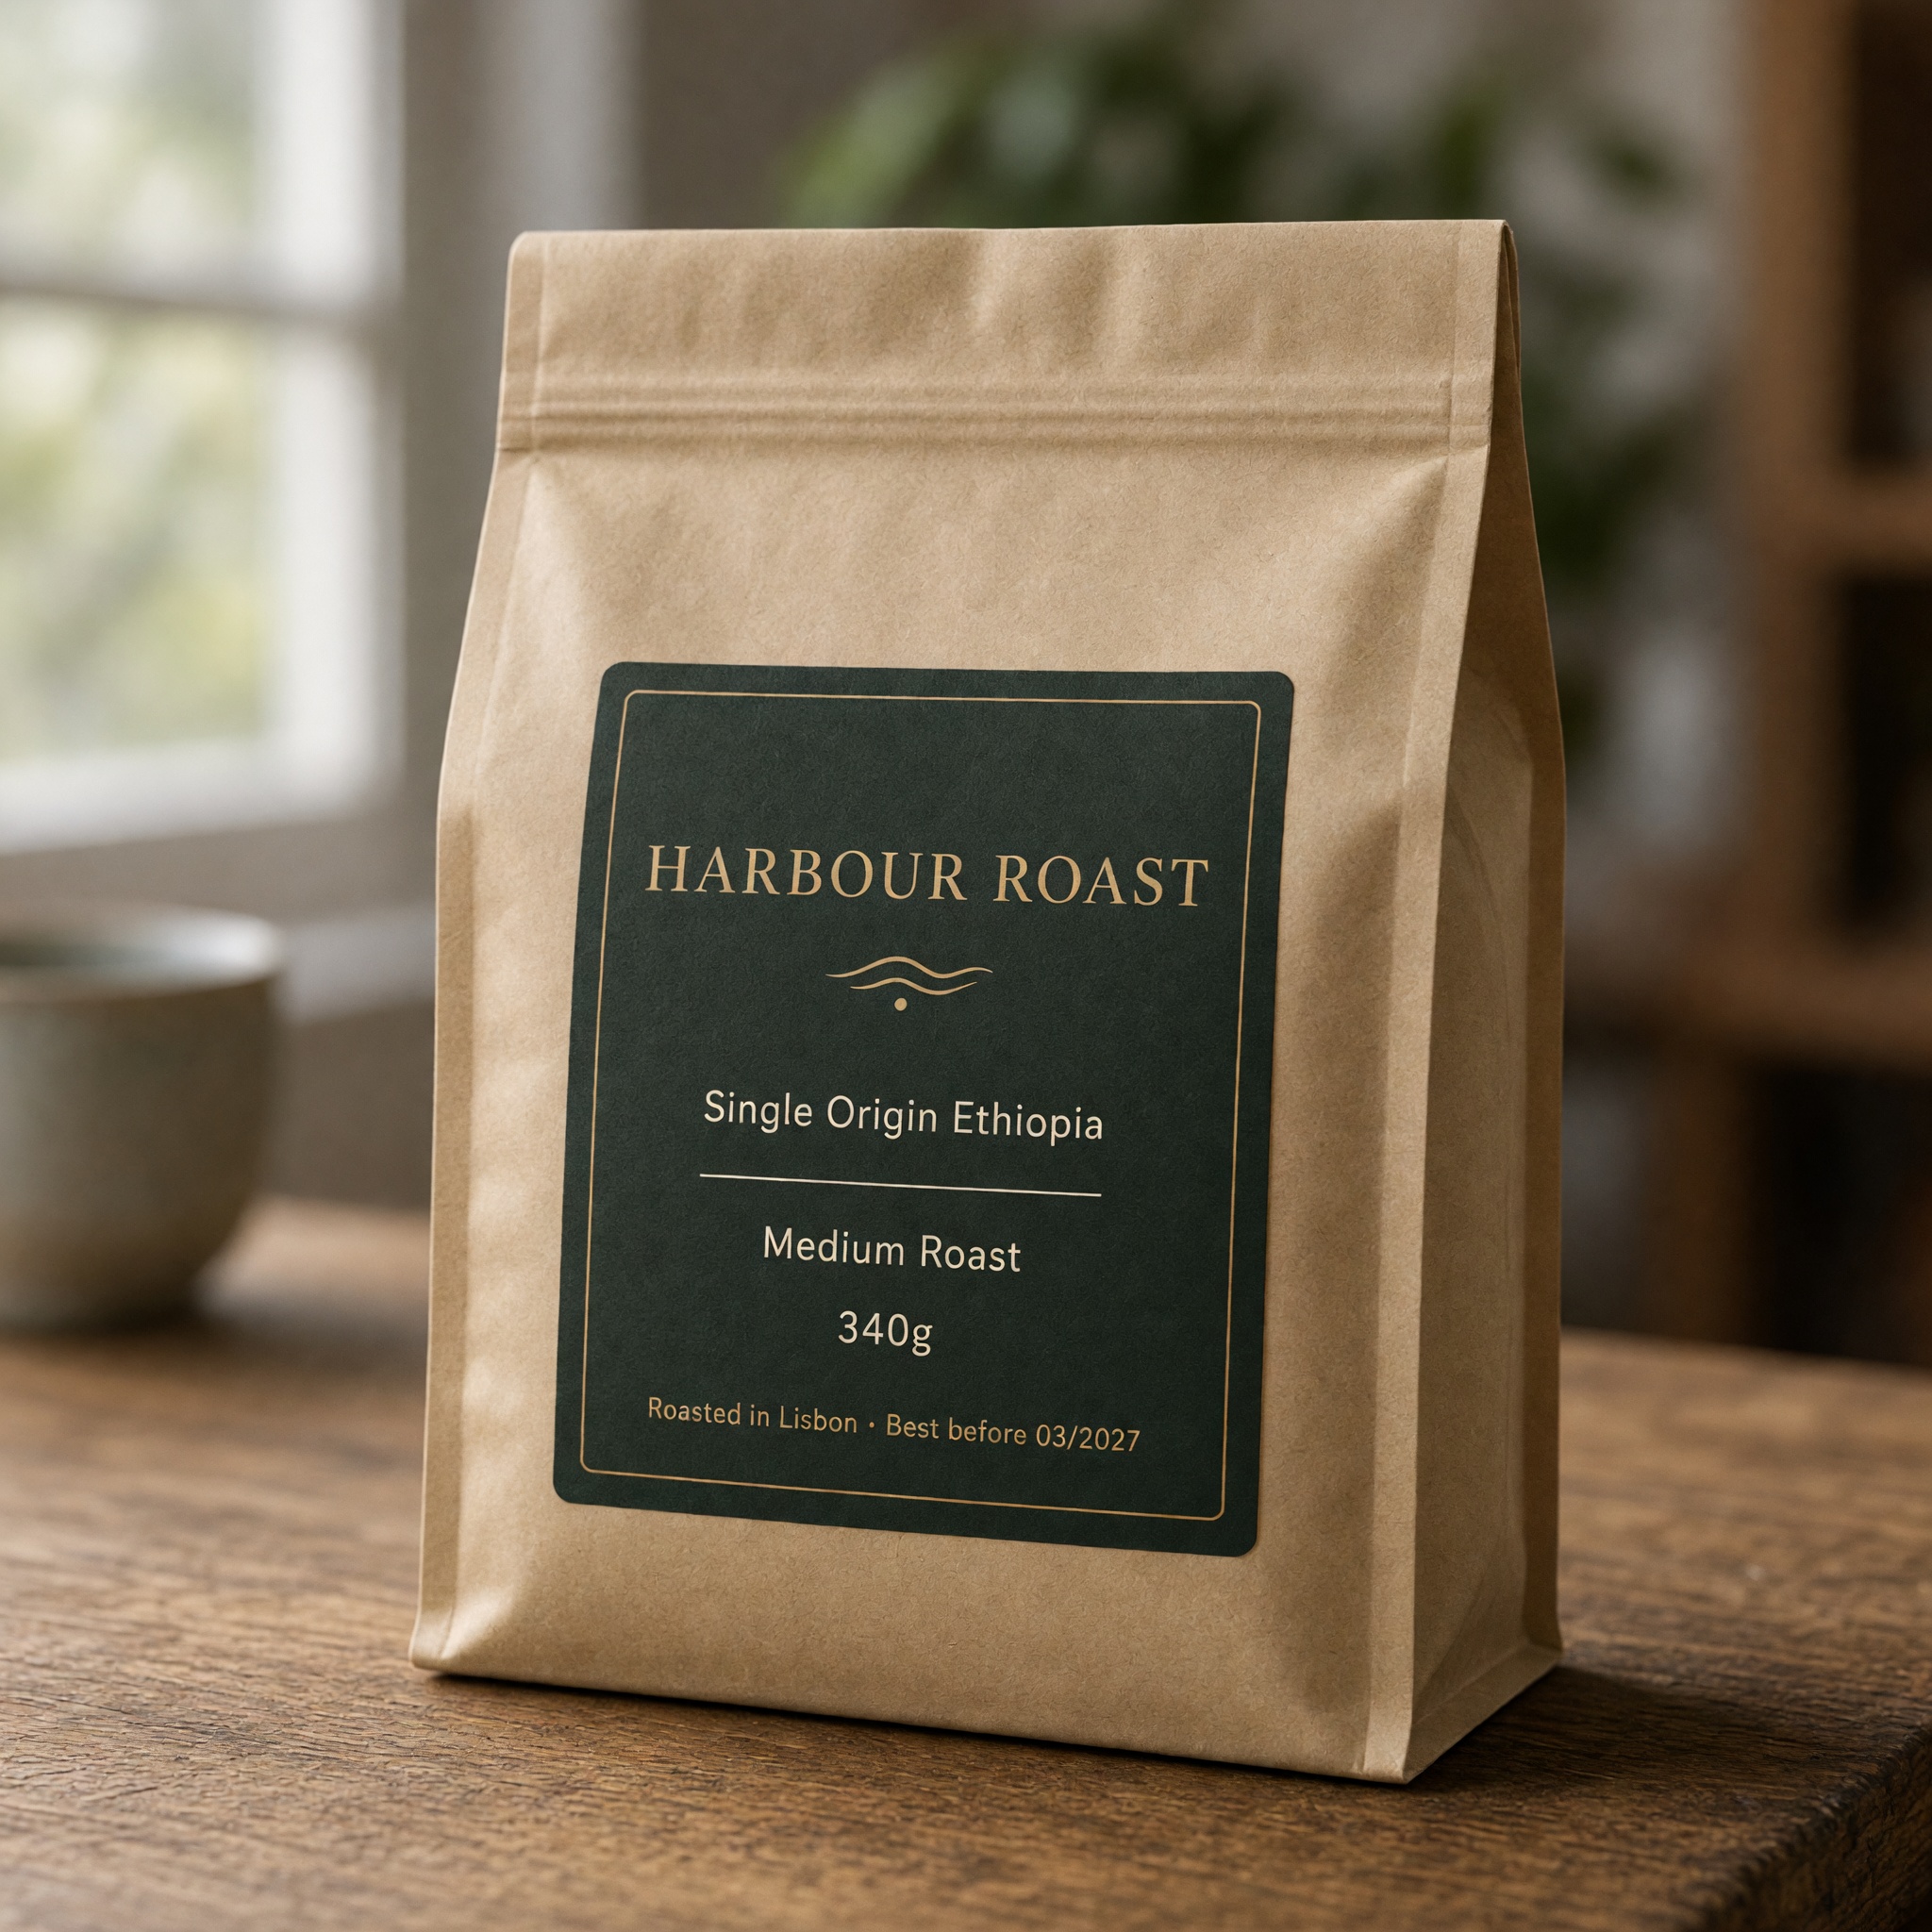
Five separate strings, in perspective, down to 6pt-equivalent small print: HARBOUR ROAST, Single Origin Ethiopia, Medium Roast, 340g, Roasted in Lisbon · Best before 03/2027 — all exact.
What this changes: for typography, the standing "never trust text in image" caution no longer applies to this capability. Put the string in the prompt as
reading exactly: … and it comes back character for character — on a flat poster and on a photorealistic packshot with perspective and small print.The case where it fails — and why it is the dangerous one
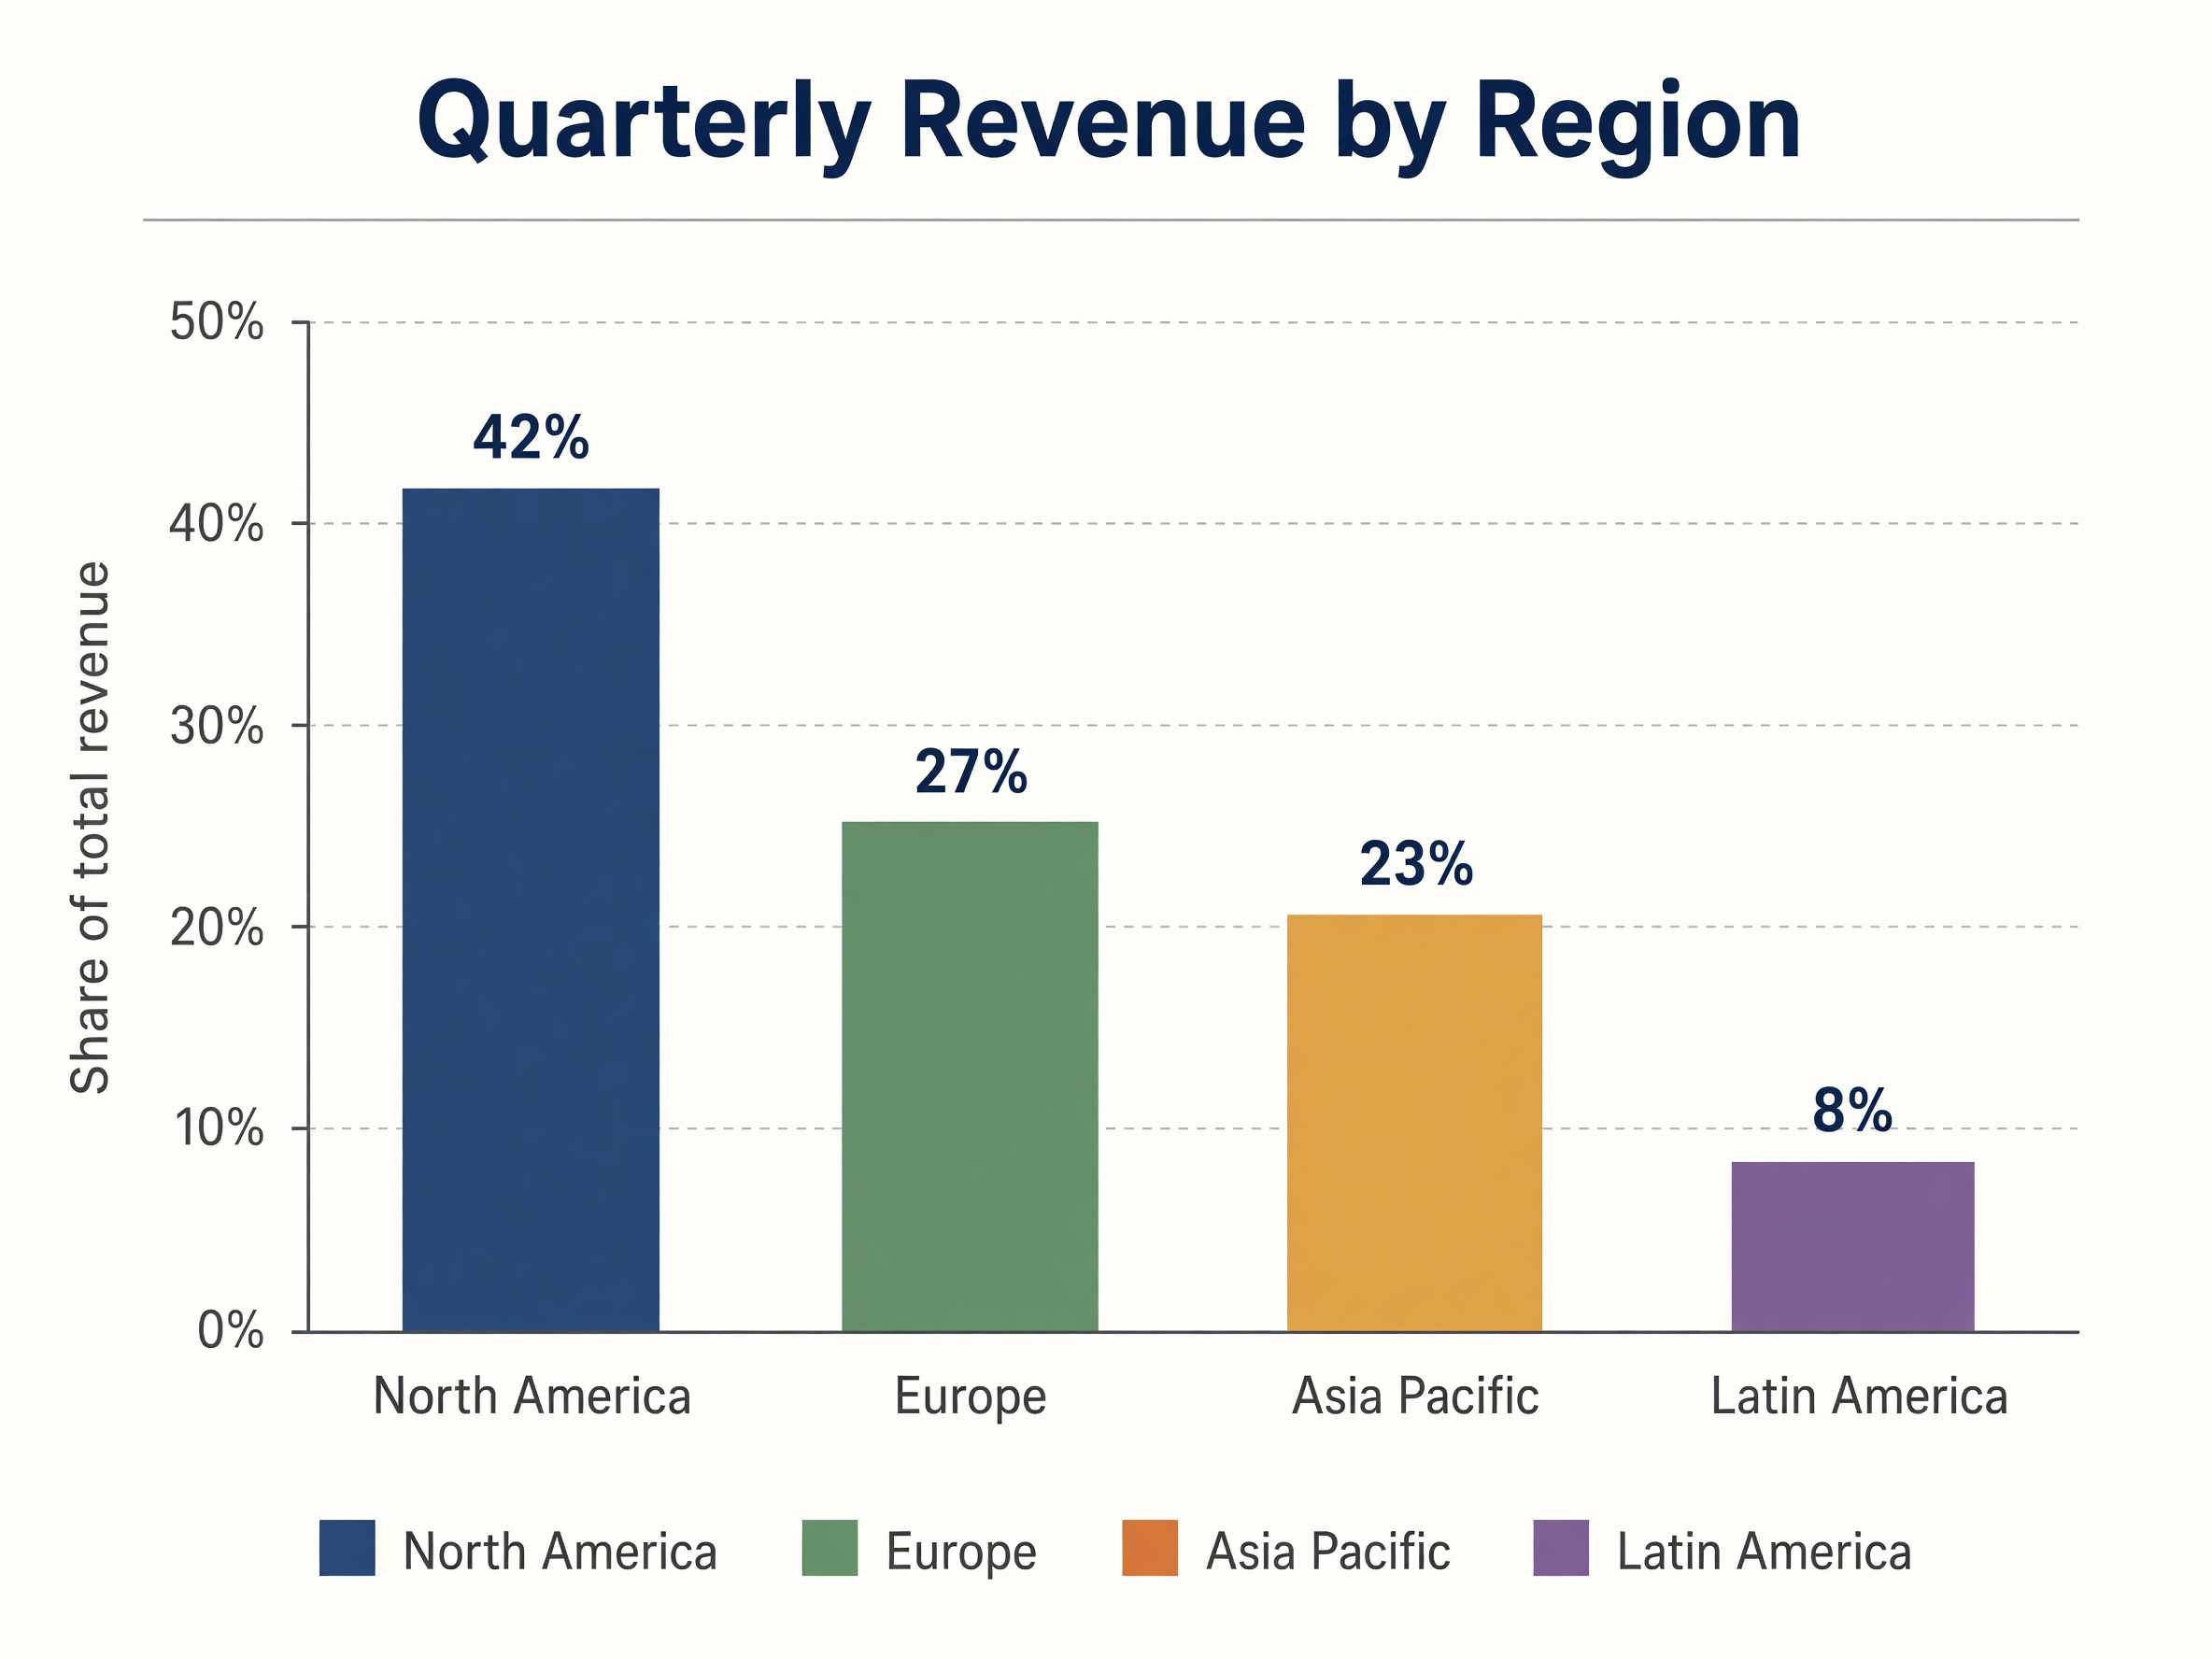
Every label is right — title, four region names twice over, four percentages, the axis label. Every bar is not.
| Region | Label says | Bar drawn at | |
|---|---|---|---|
| North America | 42% | ~41.5% | ✓ |
| Europe | 27% | ~25% | ✗ |
| Asia Pacific | 23% | ~20.5% | ✗ |
| Latin America | 8% | ~8% | ✓ |
This is more dangerous than garbled text, not less. Mangled letters announce themselves — nobody ships that poster. A chart whose labels are perfect and whose bars are wrong looks finished, and the error survives review. The distinction is between text as shape (reliable here) and text as a label for a quantity the image also draws (not reliable). For anything encoding a number as a length, angle or area, use
sensenova-u1-infographic or render the chart deterministically and composite it.What we measured
- 5/5 successful renders at 1K · p50 106.6s · p95 114.4s
- Slow for an image model —
flux-schnellis ~2s. This is a deliberate pick for text-critical work, never a default. - $0.063/image at the pinned 1K medium tier; 2K is $0.084.
num_imagesbills per image.